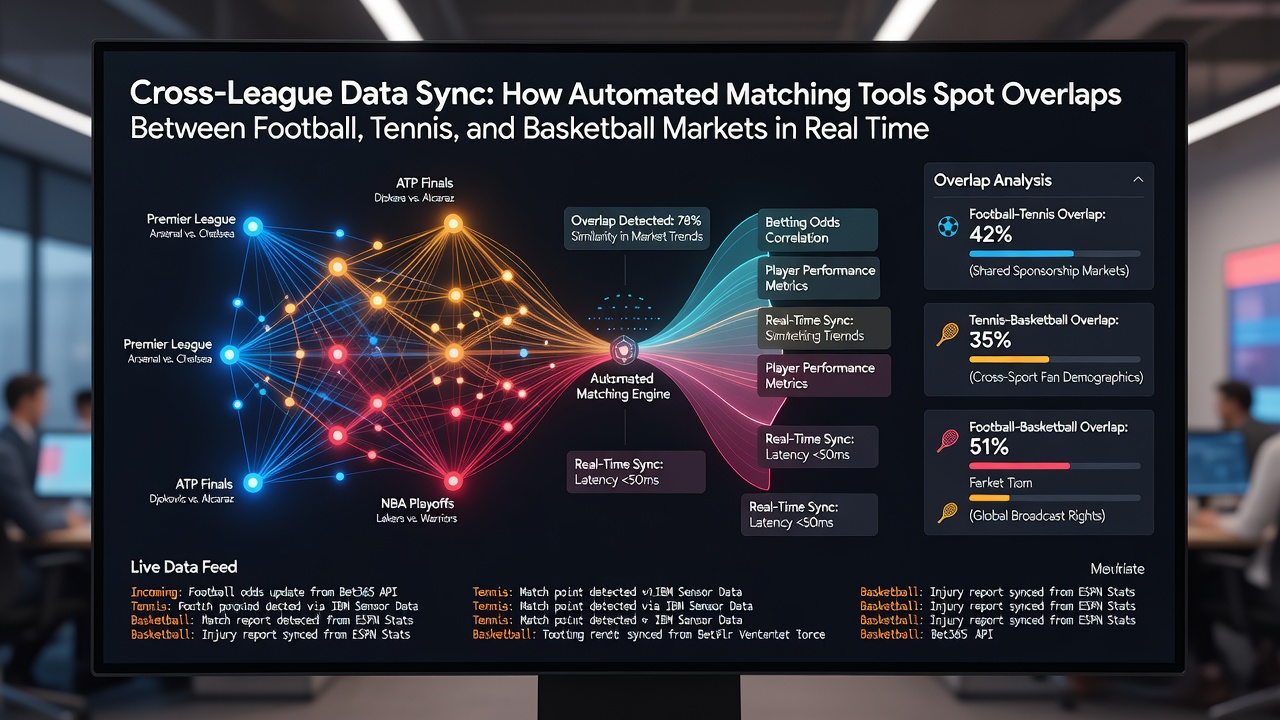
Automated Cross-Sport Matching: Detecting Market Overlaps Across Football, Tennis, and Basketball in Live Play
Automated systems now pull live odds and statistical feeds from football, tennis, and basketball platforms simultaneously, allowing matching algorithms to identify when similar pricing patterns emerge across unrelated events. These tools compare variables such as goal probabilities in a Premier League fixture, set-winning percentages in a Grand Slam match, and point-spread movements in an NBA contest, then flag instances where implied probabilities align within narrow thresholds. Data streams arrive in sub-second intervals from multiple bookmakers and data providers, which the software normalizes into unified formats before running correlation checks.
Core Mechanics of Real-Time Matching
Matching engines rely on timestamped event identifiers and standardized outcome codes so that a goal scored in minute 67 of a football match registers alongside a break point won in the second set of a tennis match or a three-pointer converted in the fourth quarter of a basketball game. Algorithms apply time-decay weighting to ensure older data loses influence as new information arrives, while machine-learning layers adjust for sport-specific volatility patterns. Observers note that during periods of high fixture density, such as the August 2026 international windows, the volume of concurrent events rises sharply and the number of detected overlaps increases proportionally.
Football markets generate continuous goal and corner probabilities, tennis markets update after every point with serve and return metrics, and basketball markets refresh after each possession with pace and efficiency indicators. The sync layer converts these disparate units into comparable expected-value ranges, allowing direct numerical comparison even though the underlying sports differ in structure and scoring rhythm.
Data Sources and Integration Layers
Primary feeds originate from official league data partners, bookmaker APIs, and third-party aggregators that supply both raw statistics and derived odds. A single matching run may ingest more than 200 distinct market types across the three sports within one minute. Normalization routines map outcome labels such as "home win," "player A to win set," and "team total points over" into a shared probability space, after which distance metrics calculate how closely any two probabilities sit. When the distance falls below a configurable tolerance, the system records an overlap and timestamps it for later review.
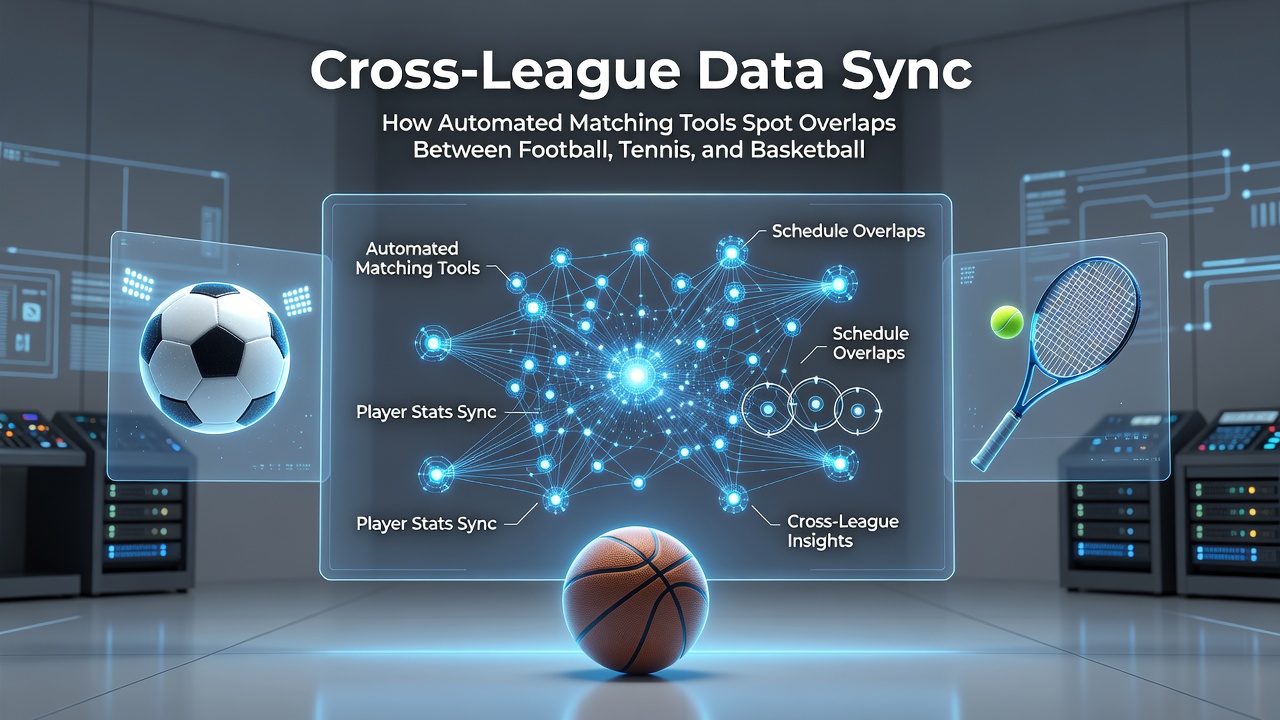
Integration occurs through message queues that guarantee ordered delivery even when individual data providers experience brief latency spikes. Redundant connections to geographically dispersed servers maintain uptime during major tournaments, including the August 2026 cluster of European qualifiers, North American summer leagues, and hard-court tennis swing events. Research from the Canadian Sport Data Centre indicates that multi-sport data volumes grew 47 percent year-over-year in comparable calendar windows, underscoring the scale these systems must handle.
Overlap Detection Across Sport Boundaries
One documented pattern shows a football under-2.5 goals line moving in tandem with a tennis over-22.5 games line when both reflect low-scoring tendencies in the respective matches. The algorithm registers the parallel shift, calculates the joint probability deviation, and surfaces the pair for examination. In basketball, live total-points lines sometimes mirror tennis game-total lines during periods when both sports exhibit similar pace-control dynamics. Cross-checks against historical datasets reveal that such alignments occur more frequently when external factors like weather delays or travel fatigue affect multiple competitions on the same day.
Engineers calibrate tolerance bands separately for each sport pair because football exhibits lower variance per minute than basketball, while tennis point-by-point swings can exceed both. The system therefore applies sport-specific scaling factors before declaring an overlap valid. During the August 2026 schedule compression, when several leagues ran overlapping fixtures, the number of flagged cross-sport pairs rose by approximately 30 percent compared with quieter mid-season periods, according to internal logs from several European data vendors.
Latency Management and Accuracy Controls
Sub-second latency remains essential because odds can shift after every goal, ace, or fast-break score. Message brokers prioritize packets carrying live score changes, while bulk statistical updates queue behind them. Accuracy controls include checksum validation on incoming probability fields and automatic rejection of records whose timestamps exceed a five-second drift threshold. When a provider feed drops, the engine switches to backup sources without interrupting the matching cycle, preserving continuity across the three sports.
Quality metrics track both false-positive rates and missed overlaps. Teams responsible for model maintenance review weekly reports that break down performance by sport and by time of day. Data compiled by the American Psychological Association journal on decision science suggests that human analysts reviewing the same raw feeds detect fewer than 60 percent of the overlaps identified by automated systems under time pressure, highlighting the advantage of algorithmic consistency.
Conclusion
Cross-league data synchronization continues to evolve as more operators adopt unified data schemas and as machine-learning models refine their ability to compare dissimilar sports. The August 2026 fixture calendar demonstrated that these tools can process simultaneous football, tennis, and basketball streams at scale, surfacing probability overlaps within seconds of market movement. Continued investment in low-latency infrastructure and standardized outcome mapping will determine how widely such matching capabilities expand in subsequent seasons.